Spend reporting and analytics
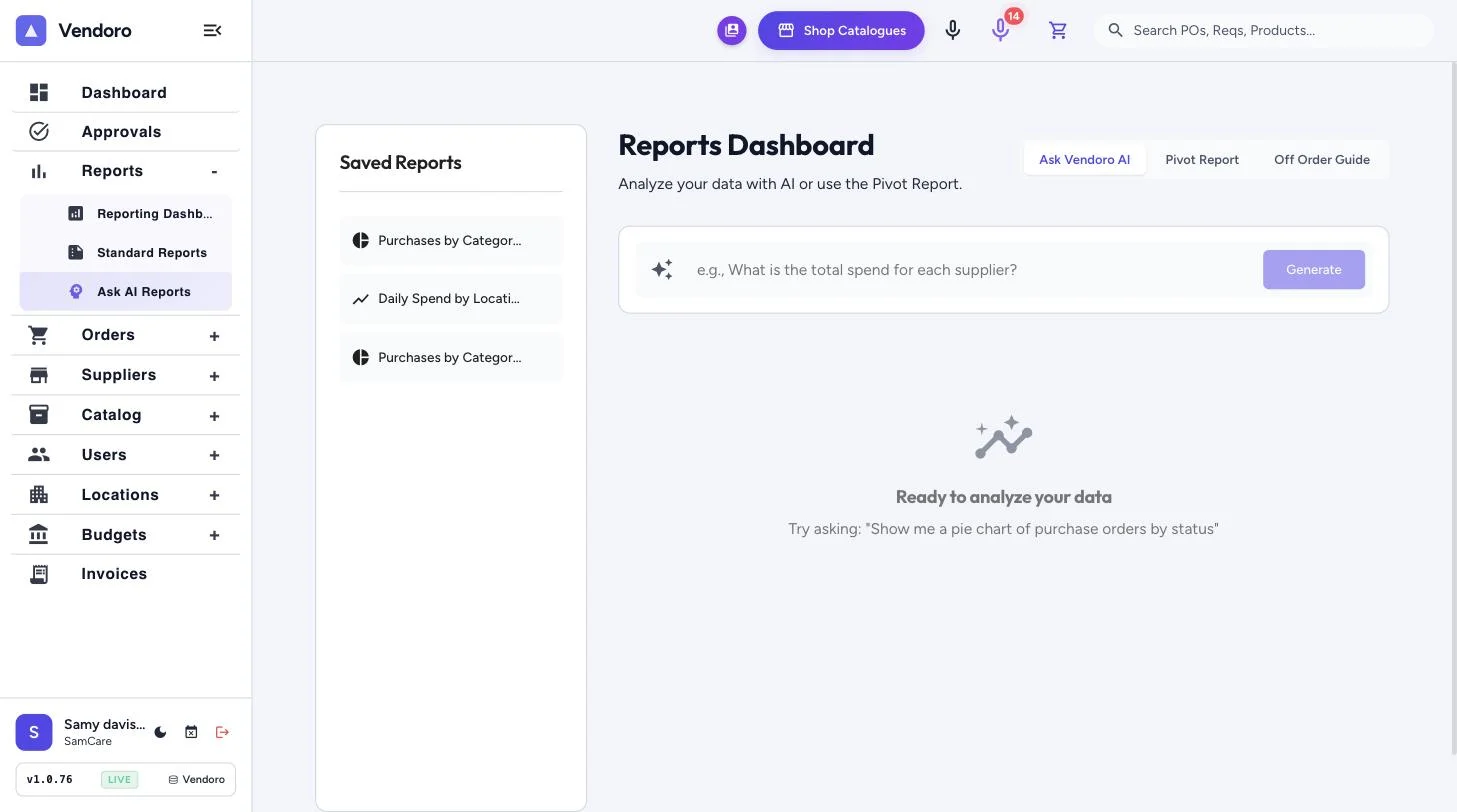
Vendoro’s Reporting Dashboard shows spend by location, category and supplier, and budget against actual, with pivot and group-by reports by order or delivery date. Standard reports such as Budget vs. Spend are ready-made, and Ask AI answers plain-English questions from your data, showing the query behind every answer.
What’s in Reports
| Report | What it shows |
|---|---|
| Reporting Dashboard | Spend by location, top categories, budget vs. actual, spend by supplier; Overview, Current Budgets, Group By and Pivot views |
| Standard Reports | Budget vs. Spend: each location’s budget against spend, by category and month, with an Excel export |
| Ask AI Reports | Plain-English questions answered from your data, saved reports, and the Off Order Guide report |
| Dashboard | What needs attention, POs to receive, this week’s budget and spend by category |
Frequently asked questions
Can reports use delivery date instead of order date?
Yes. The Reporting Dashboard can use either.
Can Ask AI change data?
No. Questions become read-only queries, and the query is shown with the answer.