Reports and Ask AI
The reporting dashboard, standard reports, and plain-English questions.
Everything is under Reports.
Reporting Dashboard
Charts of spend by location, top category spend, budget vs. actual spend and spend by supplier. Views: Overview, Current Budgets, Group By Report and Pivot Report. Choose whether dates mean the order’s create date or delivery date, pick a range from 1D to 1Y on each chart or set a custom range, choose a location or a whole location group, and show budgets whole or prorated.
Standard Reports
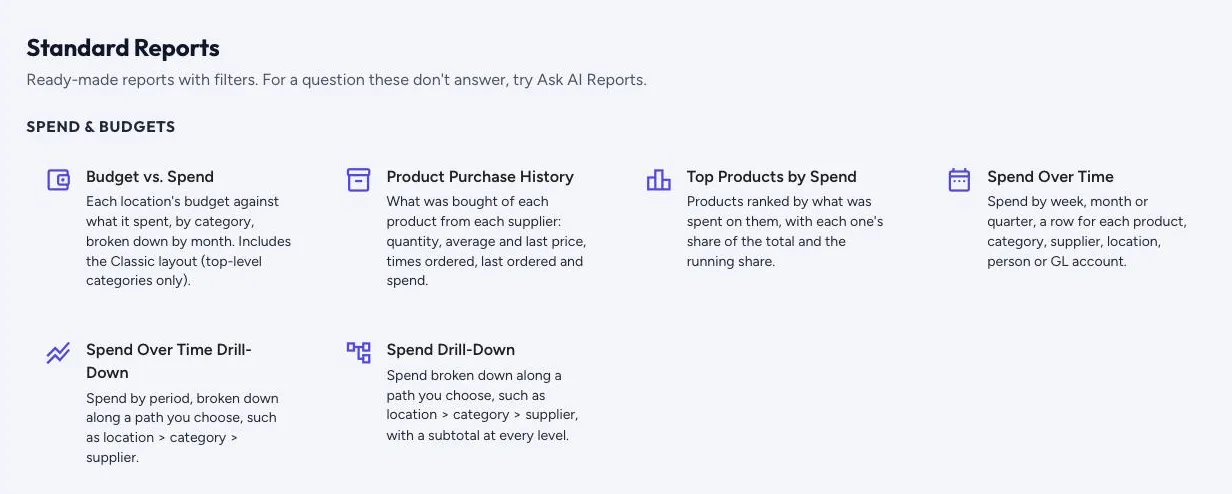
Ready-made spend and budget reports with filters: Budget Burn-Down, What We Paid Per Product, Biggest Spend, Ranked, Spend by Period, Spend by Period, Unpacked and Spend, Unpacked. Each card shows a sketch of the report, larger when you hover. See Spend reports.
Ask AI Reports
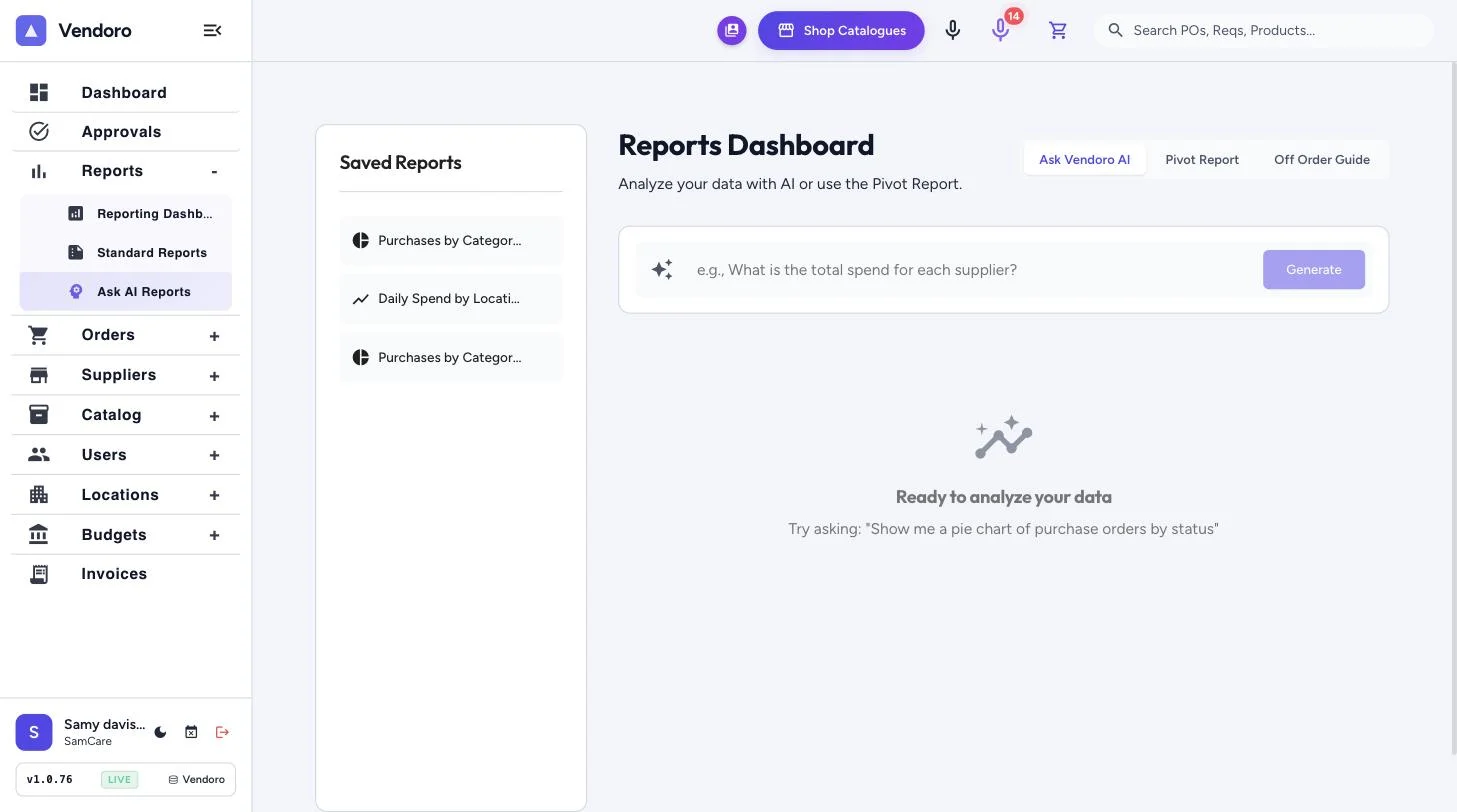
Type a question such as “What is the total spend for each supplier?” and choose Generate. Vendoro turns it into a read-only query, answers from your data and shows the query. Pivot Report and Off Order Guide are one click away, and reports you keep appear under Saved Reports. Ask AI can’t change anything.